
As always, our goal is to inform and educate our readers on mortgage rates, the factors impacting them, and provide tips for successfully navigating the mortgage process.
Rates have risen considerably from the historic lows seen during the pandemic. Has that rise impacted mortgage applications?
Indeed, it has! Black Knight, “an award-winning software, data and analytics company that drives innovation in the mortgage lending and servicing and real estate industries” tracks a wide range of mortgage data. Let’s look at some of that! (All charts courtesy MBSLive.net and MortgageNewsDaily.com)
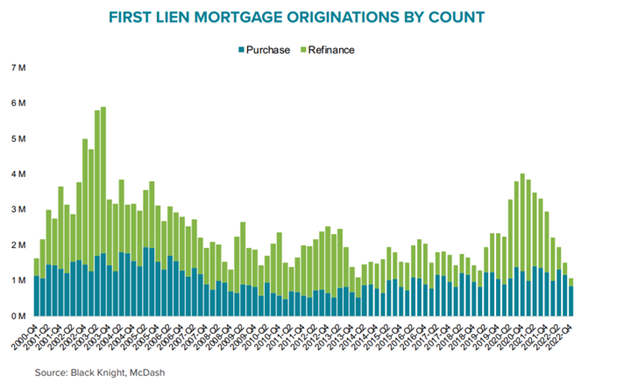
The green portion of the chart’s bars is the refinance share of all mortgage originations. At its most recent peak in Q4 2020, three times more refinances than purchases were closed. Fast forward to Q4, 2022, and what do we see? Purchase loan volume is now roughly 5 times the refinance volume. Total loan volume for Q4 2022 is only 25% of the pandemic’s peak in late 2020.
How does the number of current purchase loans compare with recent years? Has it dropped as much as refinances?
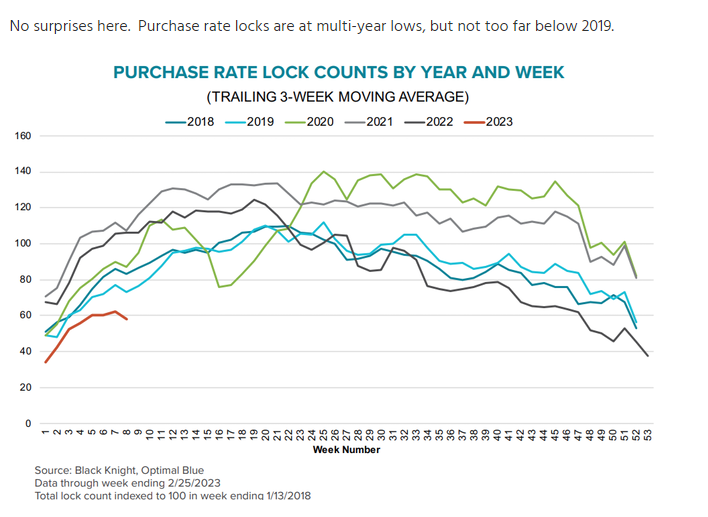
It’s not just refinance originations that have dropped dramatically. Compared with the prior 5 years, purchase rate locks are at their lowest seasonal level. Why? Homeowners who refinanced to record low rates the last several years may be reluctant to move, knowing the rate on their new home’s mortgage would rise considerably from their current loan. The good news? 2023 purchase rate lock numbers have improved considerably from the end of 2022.
OK, I get it, loan numbers are down. Why would anyone refinance in today’s market, given rates’ current levels?
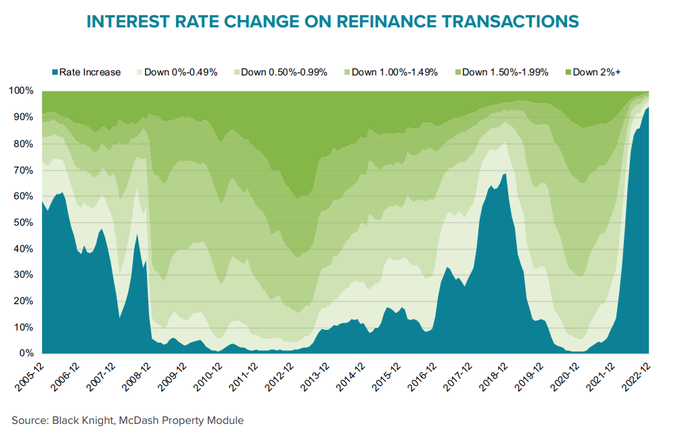
The green areas above are the share of refinances which dropped borrowers’ rates. The darker green represents rate drops of 2%+, while the blue area shows the % of refinances where rates rose. Why would someone refinance to a higher rate? The most common reason is cash out refinances, which are far less dependent on interest rates compared with “rate/term” refinances. Cash out borrowers often refinance to pay off high-cost credit card or other consumer debt. With the Federal Reserve aggressively raising its overnight rate, interest rates on both home equity lines and credit cards have risen far faster than mortgage rates. In any case, 90% of current refinances now close at a higher rate than the mortgages being paid off.
Home prices have been rising rapidly, perhaps even unsustainably. Is that still the case, or can homebuyers expect to see more stable values this spring?
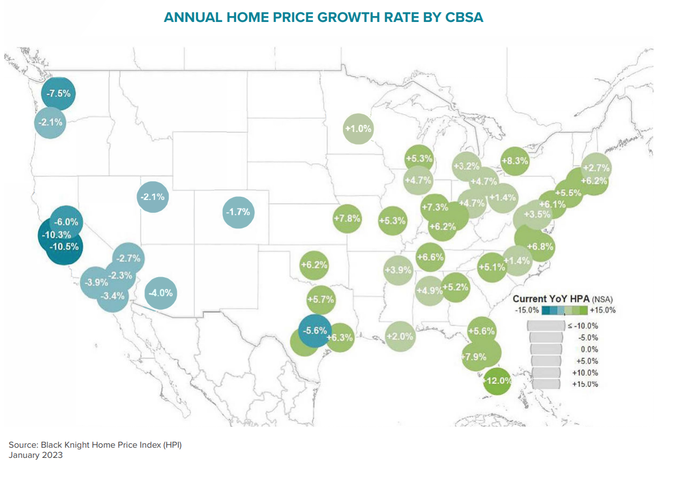
Home appreciation had, in fact, been well above historic norms the last two years. Data for Feb 2022- Feb 2023, however, shows slower appreciation in much of US, and outright drops in areas with the greatest prior gains (we’re looking at you, California). The bottom line? Today’s real estate market is becoming more balanced between buyers than sellers. Bidding wars aren’t as common as in the recent past.
I read something about PMI changing on certain loans. Can you tell me more about that?
HUD announced changes to the mortgage insurance costs new FHA borrowers pay on February 22nd. As a reminder, mortgage insurance protects lenders and loan guarantors from losses on loan defaults. FHA loans have “MIP”, which is an acronym for “Mortgage Insurance Premium”, as compared with conventional loans “Private Mortgage Insurance.”
Most current FHA borrowers are paying an annual cost of .8% of their loan size. That cost is included in their monthly payment. The premium on most new FHA loans moved to .55%, the equivalent of a .25% interest rate drop. Will PMI rates on conventional loans drop as well? Time will tell. In any case, here’s part of HUD’s press release on the changes:
“The 30 basis point annual MIP reduction will apply to almost all Single Family Title II forward mortgages insured by FHA. Further, the reduction applies to all eligible property types, including single family homes, condominiums, and manufactured homes, all eligible loan-to-value ratios, and all eligible base loan amounts. The average FHA borrower purchasing a one-unit single family home with a $265,000 mortgage will save approximately $800 this year as a result of FHA’s premium reduction. For the same borrower with a mortgage of $467,700 – the national median home price as of December 2022 – FHA’s annual MIP reduction will save them more than $1,400 in the first year of their mortgage. In addition to providing overall savings to borrowers, a lower annual MIP can also help more people qualify for a mortgage.”
Note that HUD did NOT change its pricing on existing FHA loans, those borrowers will continue to pay the same MIP costs, in most cases until their loans are paid off!
I try to track interest rates, but there’s often conflicting data reported. Is the Freddie Mac weekly rate survey I see cited every Friday a good gauge of current rates?
Now THIS is a great question! As always, the devil is in the details. Freddie Mac’s weekly rate survey is often touted as the definitive source to track mortgage rates. Every Monday, lenders receive a rate poll from Freddie Mac. A large majority respond that day with their current rates, while some respond Tuesday with Tuesday’s rates. Freddie Mac, however, doesn’t release the poll results until late Thursday, which is then reported on Friday. By then, rates may have changed substantially from Monday’s levels! Freddie Mac’s survey also assumes that discount points may apply (lowering loans’ interest rates while raising their costs), while other rate trackers look at rates without discount points. The bottom line? Freddie Mac’s survey is useful for tracking Monday to Monday rate changes, but those are often outdated by the time the survey is released. Just as you wouldn’t expect a stock quote from Monday to be accurate Friday, don’t assume that Freddie Mac’s Monday data is current several days later! Here’s a chart showing Mortgage News Daily’s daily rate data versus Freddie Mac’s weekly data:
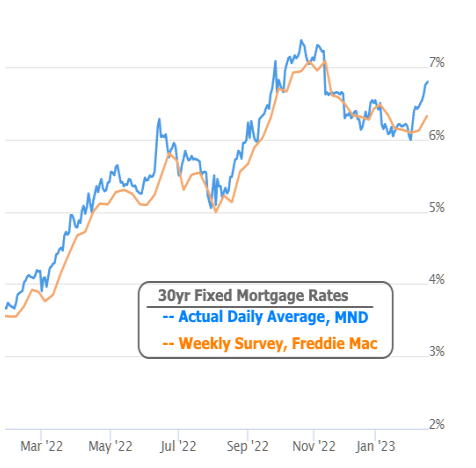
While the two follow each other, Freddie Mac’s data lags considerably at times, including last week when actual rates were roughly .5% above those Freddie Mac reported. The moral of the story? Just because something is widely reported doesn’t mean it’s absolutely accurate.
I read that Silicon Valley Bank being taken over by the FDIC panicked investors. Has the prospect of additional bank defaults impacted interest rates?
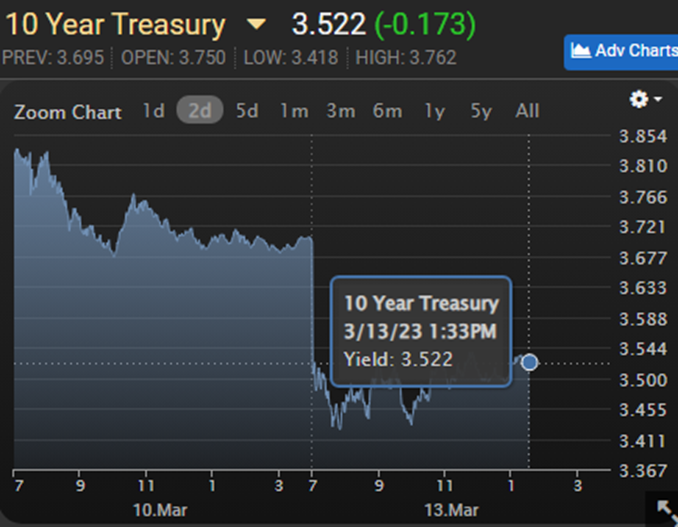
Economic uncertainty (in this case, potential bank failures) tend to boost demand for low risk “safe” investments such as Treasury and mortgage bonds. Higher demand translates to lower interest rates. 10-Year Treasury yields (the simplest way to track rates) quickly dropped .25% after word of SVB’s default and the perception of additional bank failures. Since touching 4.0% on March 7th, Treasury yields have dropped almost .5% For perspective, a .125% change here is normally considered huge!
Since 10-Year Treasury yields dropped .50%, does that mean the rate quote I got on Friday should be .50% lower today?
No, unfortunately. When secondary managers (who set individual lenders’ mortgage rates) see abrupt, huge interest rate swings, they initially pass a portion of those swings to their rates. If Treasury yields retain the changes over several days, mortgage rates eventually reflect a larger share of the changes. One analogy would be the price of oil. If it drops abruptly on Monday, gas prices don’t immediately follow. If the wholesale oil price is still down a week later, gas prices will reflect more of the drop.
Wasn’t the February jobs report released recently? How did it impact rates?
The Labor Department released February’s Non-Farms Payroll (NFP) report March 10th, the morning after FDIC’s Silicon Valley Bank shutdown stunned rate markets. NFP reports contain significantly more data than the “jobs gained/lost” number that is widely reported, and that data is often mixed, including this month. The February report showed larger than expected job growth, but lower wage growth than anticipated (lower wages reduces inflation concerns, higher numbers of new jobs may incite inflation fears). In any case, banking contagion concerns relegated NFP data largely obsolete, for the moment at least.
So, where do we go from here? Will rates continue to drop, or just bounce back up?
There is simply no way whatsoever for the most brilliant bond pundits to do much more than guess future interest rate levels. There’s simply too many variables involved. We can anticipate some of those (Fed rate increases, inflation concerns, jobs reports), but there’s always the possibility of “black swan events” as well. “Black swans” are unforseen events that can’t be predicted. We’ve seen at least two recently, the Covid-19 pandemic and now Silicon Valley Bank’s failure. The bottom line is that anyone who purports to know where rates are heading is making an educated (or NOT!) guess!
Maybe I’ll keep renting until rates drop, even though we need more space.
Meeting your family’s housing needs is more important than your mortgage rate. As the old expression goes, “You date the rate but marry the house!” Translation? You can always refinance down the road if rates drop, so first and foremost concentrate on finding the best home for your situation.